Single-cell RNA-seq ties macrophage polarization to growth rate of intracellular Salmonella
Antoine-Emmanuel Saliba
, Lei Li, Alexander J. Westermann, Silke Appenzeller, Daphne A. C. Stapels, Leon N. Schulte, Sophie Helaine,
Jörg Vogel
Link to the publication
Welcome to our interactive web interface which allows you to access the single-cell mRNA Seq data from
Single-cell RNA-seq ties macrophage polarization to growth rate of intracellular Salmonella
by Antoine-Emmanuel Saliba et al. (Nature Microbiology, 2016)
Intracellular bacterial pathogens can exhibit large heterogeneity in growth rate inside host cells, with major consequences for the
infection outcome. If and how the host responds to this heterogeneity remains poorly understood. Here, we combined a fluorescent reporter
of bacterial cell division with single-cell RNA-sequencing analysis to study the macrophage response to different intracellular states of
the model pathogen Salmonella enterica serovar Typhimurium. The transcriptomes of individual infected macrophages revealed a spectrum of
functional host response states to growing and non-growing bacteria. Intriguingly, macrophages harbouring non-growing Salmonella display
hallmarks of the proinflammatory M1 polarization state and differ little from bystander cells, suggesting that non-growing bacteria evade
recognition by intracellular immune receptors. By contrast, macrophages containing growing bacteria have turned into an anti-inflammatory,
M2-like state, as if fast-growing intracellular Salmonella overcome host defence by reprogramming macrophage polarization. Additionally, our
clustering approach reveals intermediate host functional states between these extremes. Altogether, our data suggest that gene expression
variability in infected host cells shapes different cellular environments, some of which may favour a growth arrest of Salmonella facilitating
immune evasion and the establishment of a long-term niche, while others allow Salmonella to escape intracellular antimicrobial activity and
proliferate.
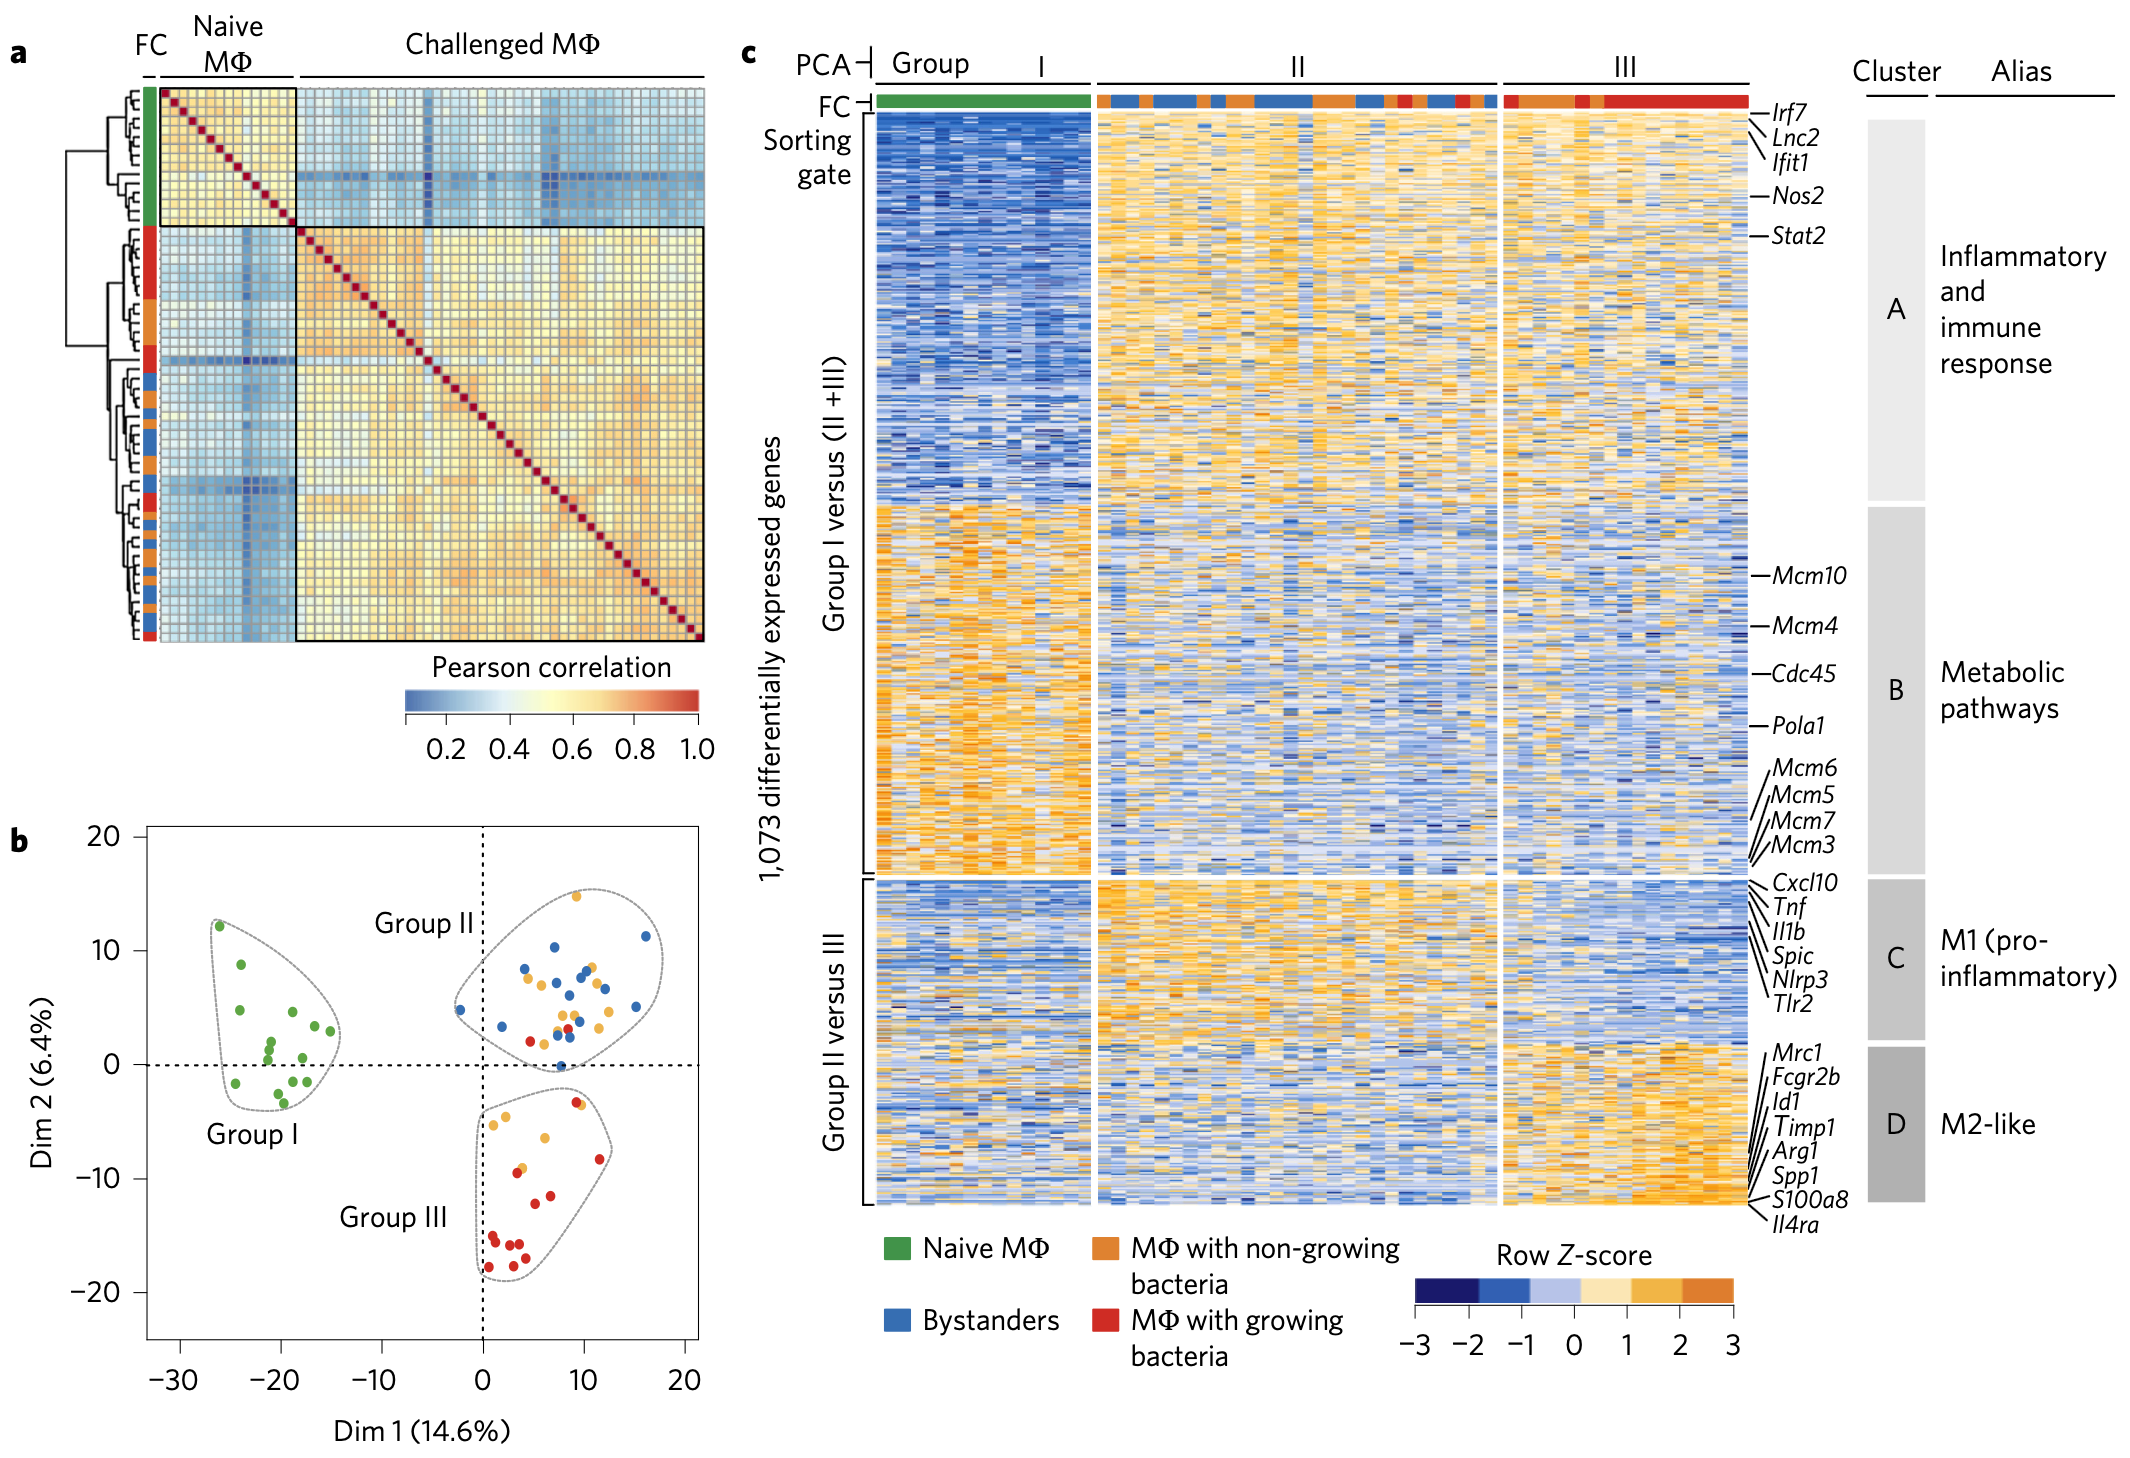
Figure 2 | Single-cell RNA-seq profiling reveals specific transcriptional signatures associated with MΦs containing non-growing or growing Salmonella. a, Gene expression correlation between individual cells from distinct sorting fractions. The heatmap displays Pearson’s r values clustered on the y axis by the euclidian method (dendrogram). This matrix revealed the existence of two major groups of cells corresponding to naive and challenged cells. Colours indicate cellular identities as inferred from the original FC gates. b, PCA allowed for a refinement of the group of challenged cells into groups II and III (group I: naive MΦs). Each dot represents a single cell (60 cells in total). Colours indicate cellular identities as inferred from the original FACS gates. c, Transcriptional profiles specific to individual cell groups (60 cells in total). A total of 1,073 genes were differentially expressed, as identified by SCDE (P < 0.01; Supplementary Fig. 7) among the three cell groups identified in b, and were grouped into individual gene clusters (A–D) and plotted as a heatmap. Clusters A and B are derived by comparing naive cells to challenged cells, labelled respectively cell groups I and II plus III on the PCA map. Clusters C and D are derived by comparing cell groups II and III (Supplementary Fig. 7 and Supplementary Table 2b–d).
Contact:
Antoine-Emmanuel Saliba:
emmanuel.saliba@helmholtz-hiri.de
Jörg Vogel:
joerg.vogel@helmholtz-hiri.de
Saliba lab - Single Cell Analysis
Helmholtz Institute for RNA-based Infection Research
Josef Schneider Str. 2/ D15, D-97080 Würzburg
Cell information vs assay expression on reduced dimensions
In this tab, users can visualise both cell information and gene expression side-by-side on low-dimensional representions.Coexpression of two genes on reduced dimensions
In this tab, users can visualise the coexpression of two genes on low-dimensional representions.Cell information / assay expression violin plot / box plot
In this tab, users can visualise the assay expression or continuous cell information (e.g. Number of UMIs / module score) across groups of cells (e.g. libary / clusters).Gene expression bubbleplot / heatmap
In this tab, users can visualise the gene expression patterns of multiple genes grouped by categorical cell information (e.g. library / cluster).The normalised expression are averaged, log-transformed and then plotted.
This webpage was made using ShinyCell2